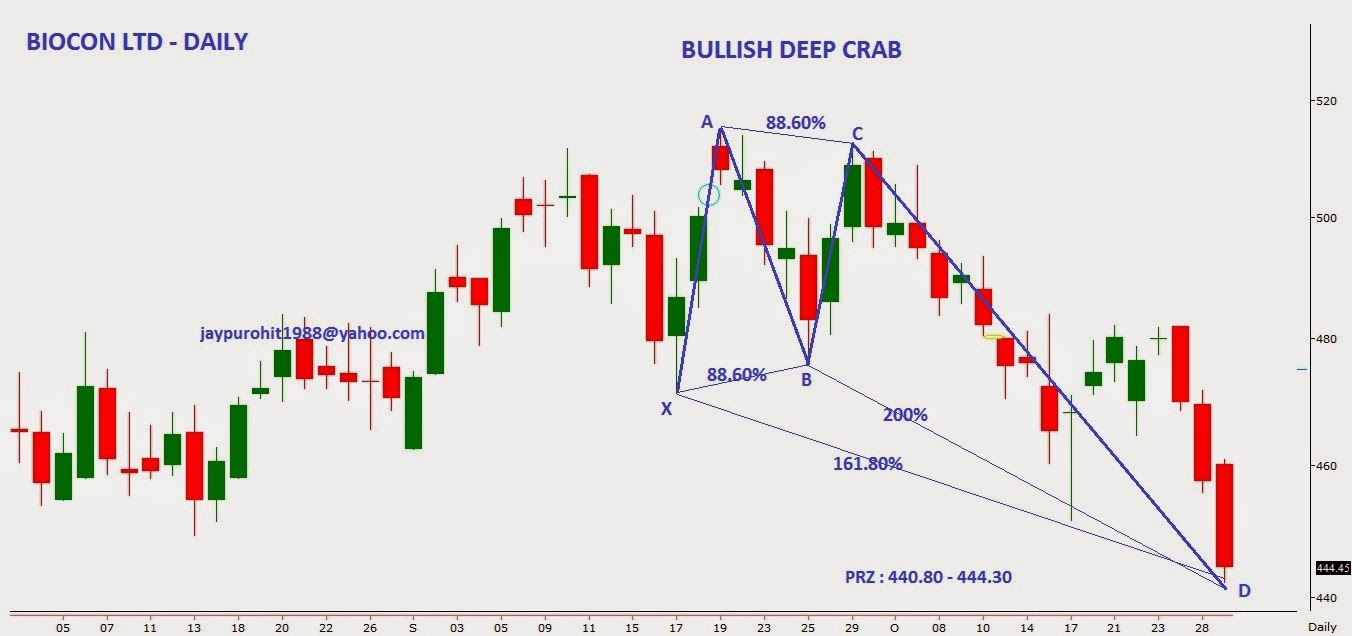
We are witnessing emergence of two harmonic patterns in the daily chart of Biocon Ltd viz Bullish Shark Pattern and Bullish Deep Crab Pattern. Potential Reversal Zone (PRZ) of both the patterns coincides at same levels i.e. 440-444. Thus going forward, 440 levels will going to act as strong support for the counter. A close below 436 will negate the Bullish view on the stock.
Bullish Shark Pattern
Bullish Deep Crab Pattern


