Technical & Derivatives analysis attempts to understand the emotions in the market by studying open interest, volumes and price action. My free view and analysis is a small contribution to keeping people informed about capital market. This blog is purely for the study purpose and one shall consult their Financial Advisor before trading/investing.
Tuesday, 26 August 2014
Monday, 18 August 2014
GMR Infra - Smooth Roads Ahead...!!!
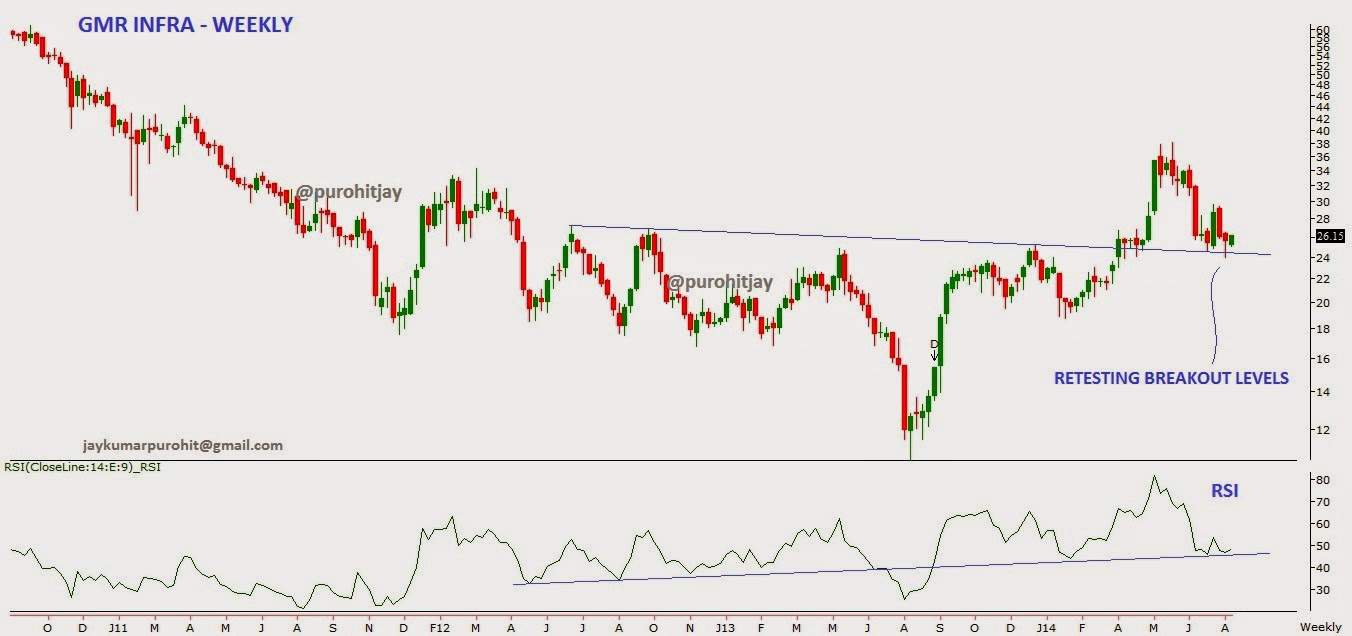
GMR Infra - Retesting of Breakout levels in weekly chart
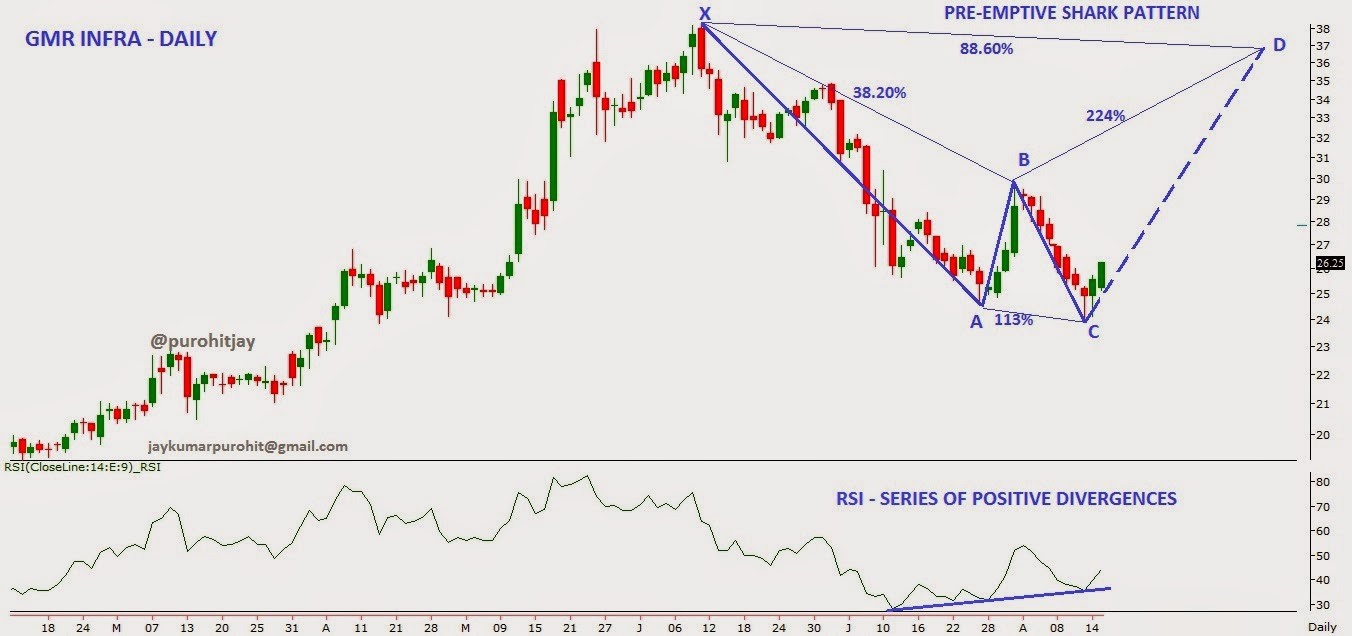
GMR Infra - Pre-emptive Shark Pattern in daily chart
Stock price of GMR
INFRA was moving in sideways direction for two years ending March 2014. The consolidation
phase has resulted into formation of ‘Inverse Head and Shoulder’ in weekly
chart. Stock has given breakout from the same in the month of April 2014.
Before achieving the full target of the mentioned pattern; stock has corrected and
reached back to the breakout levels, which is the natural tendency of the
pattern. Last week counter has retested breakout neckline, which also coincides
with 89-week EMA and started bouncing back after formation of ‘Hammer’ in daily
chart.
On
Momentum Indicator front, RSI is
moving well above the trendline in weekly chart, whereas we are observing
series of positive divergence by RSI in daily chart; indicating reversal on
cards.
If we meticulously observe the
prices in daily chart, we are witnessing emergence of a beautiful harmonic
pattern in daily chart, named as ‘Shark Pattern’.
As
all other indicators and oscillators are moving resiliently in favour of buy
side on the counter along with the harmonic pattern, I'm advising traders to go long in the stock at current market price and on dips to 23.75
for the upside targets of 33/36/42. Stop loss for the trade should be placed
below 22.85 on closing basis.
Sunday, 17 August 2014
Subscribe to:
Comments (Atom)


