Technical & Derivatives analysis attempts to understand the emotions in the market by studying open interest, volumes and price action. My free view and analysis is a small contribution to keeping people informed about capital market. This blog is purely for the study purpose and one shall consult their Financial Advisor before trading/investing.
Tuesday, 20 May 2014
Is Modi Wave over ??
“Hum Modiji ko lane wale hai.. Acche
Din aane wale hai..” - the most
popular words in India from last three months. Everything has been saffronied by
the Modi Wave.
As
anticipated by market, Modi led BJP came into power with full majority. We have
witnessed a sharp rally actoss the market. After the election results, we are
hearing the targets of 8000, 8400 in Nifty from large foreign as well as
domestic institutions. But there are couple of saying which is so common in the
stock market.
1.
“Buy on rumors, Sell on news”
2. “Sell
May and go away”
Both the
above sayings are contradicting to the bullish view of the institutions, which
creates lot of confusion among retail traders. I respect the views and analysis
of institutions, but the question is “Will market continues the upmove with
same pace or we are heading towards a correction ??” These institutions never
tells us about this, and when Nifty comes to 8000 (even after a healthy
correction upto 6000) they will speak on air about their mentioned targets.
As per my
analysis, the strident rally in Nifty and BankNifty can halt here for a while
before the next rally. Here at current juncture, I’m expecting a correction of
around 5-7% in Nifty and Bank Nifty. It will be a tough hurdle for Nifty to
close above 7550 levels. A close above 7575 will negate the bearish move in the
index and a rally towards 8000 cannot be ruled out. In contrary,
in this correction, Midcap and Smallcap counters can rally and
outperform the broader market.
Now you
must be thinking that - on what basis I’m saying all this ??
So, here is
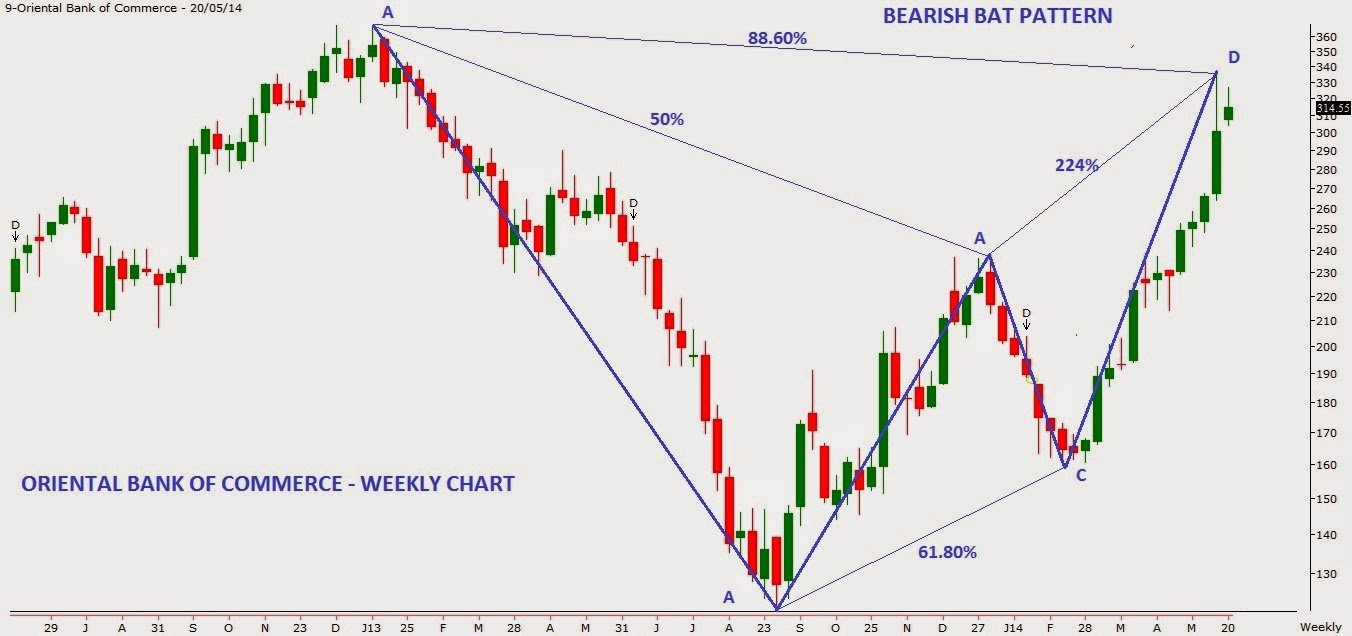
the answer – I’m observing Bearish Harmonic Pattern in many Stocks along with
Indices.
Before
looking at charts, lets discuss what is harmonic pattern ? and how it works ?
Harmonic
Patterns are one of the most reliable patterns, if plotted correctly. They are
completely centered on Fibonacci numbers. The real beauty of this pattern is
that when properly identified, it enables you to enter with the trend in a high
probability reversal zone with minimal risk. There are few Fibonacci ratios
which are commonly used while identifying harmonic pattern. These are 38.20,
61.80, 78.60, 88.60, 50, 113, 127, 141, 161.80, 200, 224, 261.80, 314 and
361.80. There are many types of harmonic patterns viz BAT, BUTTERFLY, GARTLEY,
CRAB AND SHARK.
Below are
the self-explanatory chart of Nifty, BankNifty and best shorting
candidates :
CNX NIFTY - WEEKLY CHART :
BANK NIFTY - WEEKLY CHART :
KOTAK BANK - WEEKLY CHART :
ORIENTAL BANK OF COMMERCE - WEEKLY CHART :
ACC LTD - WEEKLY CHART :
Subscribe to:
Comments (Atom)


