After hitting the 2 years high at 386, stock price of CAIRN
INDIA is moving in downtrend from last 6 months. The current downtrend seems
exhausted as stock has reached to the strong demand zone of 255 – 265 levels
and Momentum Oscillator RSI is also approaching oversold territory on the weekly
chart. A series of ‘positive divergence’ of RSI can be clearly seen in daily
chart. If we meticulously observe the prices, we are witnessing emergence of a
harmonic pattern named as ‘Bullish AB=CD Pattern’. Here, after the fall from
386 (A point) to 304.10 (B point), price has made the high of 344.40 (C point),
which is 50% retracement level of the fall (AB). After that stock is falling
and reached to 266 levels (D point), which is near 200% retracement of BC, thus
fulfilling all the criteria of ‘Bullish AB=CD pattern’. Apart from that, 100%
projection of ‘AB’ from ‘Point C’ is also placed at 263 levels, which shows the
symmetry of the pattern is perfect. Since ‘CD’ wave is slower than ‘AB’ wave,
chances of trend reversal is high. Thus, one can buy this stock at
current levels (262) and on dips to Rs 258 for a target price of Rs 302 - 318.
Stoploss for the trade should be placed below 253 levels on closing basis.
Technical & Derivatives analysis attempts to understand the emotions in the market by studying open interest, volumes and price action. My free view and analysis is a small contribution to keeping people informed about capital market. This blog is purely for the study purpose and one shall consult their Financial Advisor before trading/investing.
Thursday, 13 November 2014
Tuesday, 11 November 2014
Divis Lab Ltd - Striving for Leadership through Chemistry !!!
After making the all-time high of 1888.05, stock price of Divis
Lab Ltd has corrected by merely 10% in last week. The trend and momentum is
still bullish in the stock as ‘Higher Top Higher Bottom’ formation is still
intact and Momentum Oscillator RSI is taking support at 60 levels in weekly
chart. At current juncture, we are observing ‘positive reversal’ of RSI in both
daily and weekly chart, suggesting a sharp rally on cards.
Yesterday, we have witnessed ‘inside bar’ in daily chart and
the narrowest candle in last seven trading sessions (which is known as NR7).
The NR7 is a reversal pattern on either side, depending on the following price
action. Since Momentum Oscillators and Averages are positively placed, we are
expecting upward rally in upcoming days. One can buy this
stock on confirmation above Rs 1747 for a target price of Rs 1875 - 1930.
Stoploss for the trade should be placed below 1699 levels.
IDFC Ltd
The stock price of IDFC Ltd is trading in a strong uptrend in
weekly chart by preserving ‘Higher Highs Higher Lows’ formation. The ongoing
upmove seems to be a copy book ‘Impulse and Corrective Rally’ which led the
stock to bounce back sharply from some or the other Fibonacci retracement
levels. The best part of this rally is
that it is not a vertical rally, which always tends to fizzle out on profit
booking (generally a “V” shape rally is followed by a sharp sell-off too). We
are also observing the formation of ‘Inverse Head and Shoulder’ pattern in
weekly chart, whose neckline is placed at 166 levels.
Looking at the daily
chart, stock price is moving in sideways direction after hitting the 52 weeks
high of 166.65. Recently, Stock has given very strong buy signal by sustaining
above the ‘rounding formation’ which is made in past seven weeks. On Monday,
stock has retested the neckline of the rounding pattern, which also coincides
with ’10 Days EMA’, and bounced back piercingly; thus completed three days
corrective pattern. Momentum Oscillator RSI is positively placed and has taken
support of the breakout trendline in daily chart. One can buy this stock at current market price of Rs 155 and on dips to Rs 153 for a target price of Rs 176 – 187. Stoploss for
the trade should be placed below 149 levels.
Thursday, 30 October 2014
Biocon Ltd - Injected for a Short Term Rally !!!
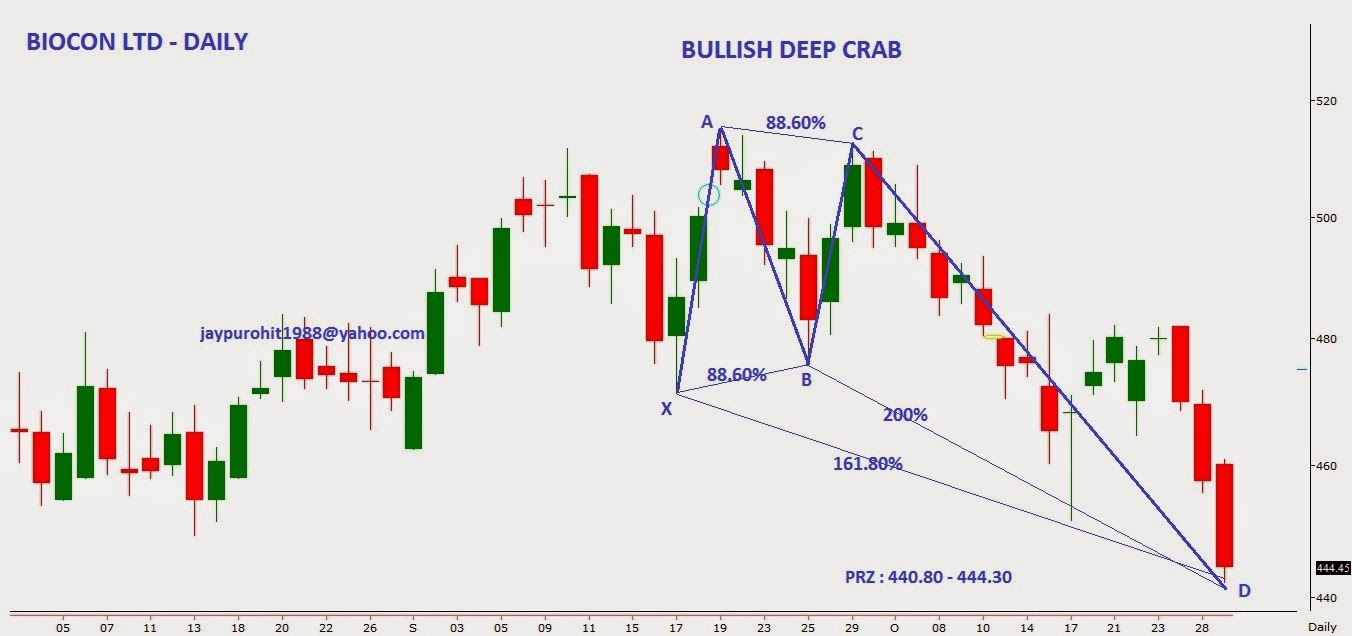
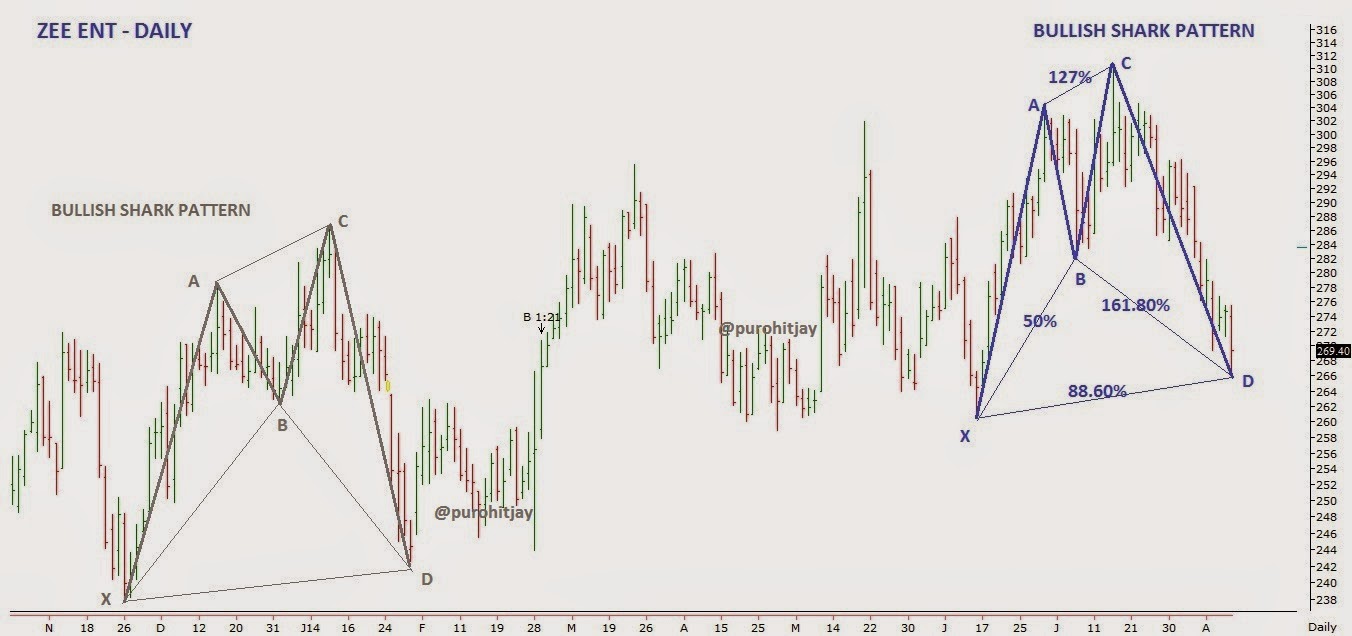
We are witnessing emergence of two harmonic patterns in the daily chart of Biocon Ltd viz Bullish Shark Pattern and Bullish Deep Crab Pattern. Potential Reversal Zone (PRZ) of both the patterns coincides at same levels i.e. 440-444. Thus going forward, 440 levels will going to act as strong support for the counter. A close below 436 will negate the Bullish view on the stock.
Bullish Shark Pattern
Bullish Deep Crab Pattern
Sunday, 12 October 2014
Tuesday, 26 August 2014
Monday, 18 August 2014
GMR Infra - Smooth Roads Ahead...!!!
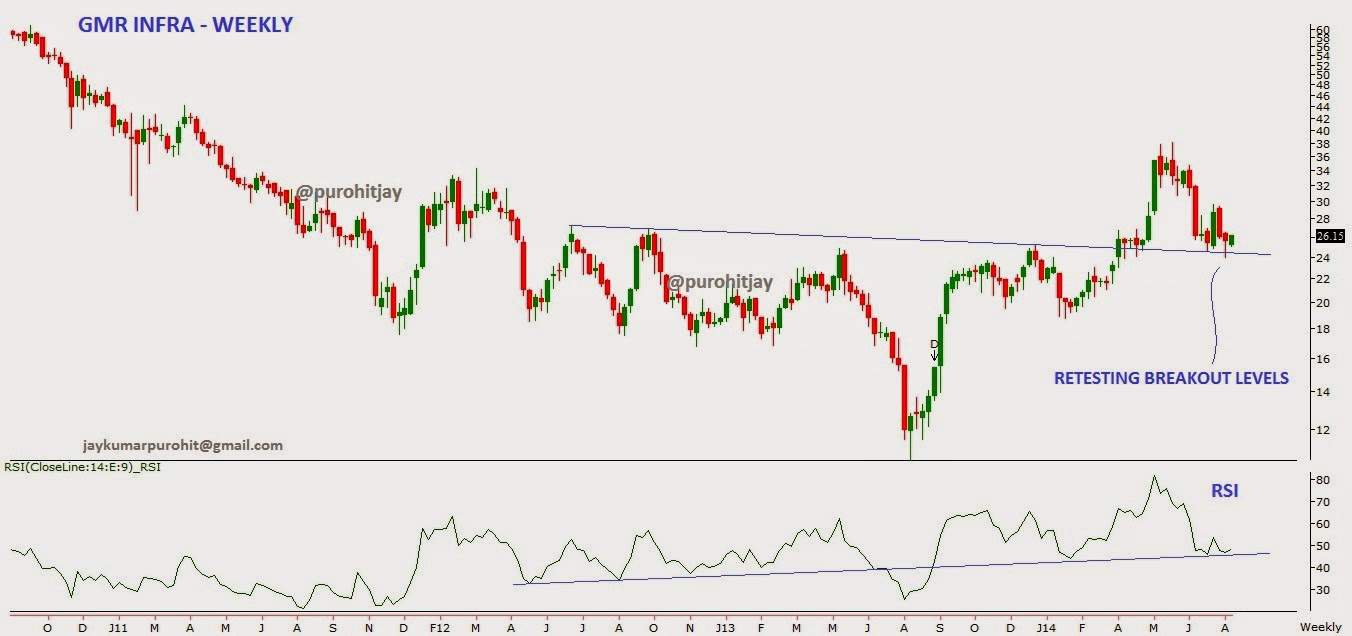
GMR Infra - Retesting of Breakout levels in weekly chart
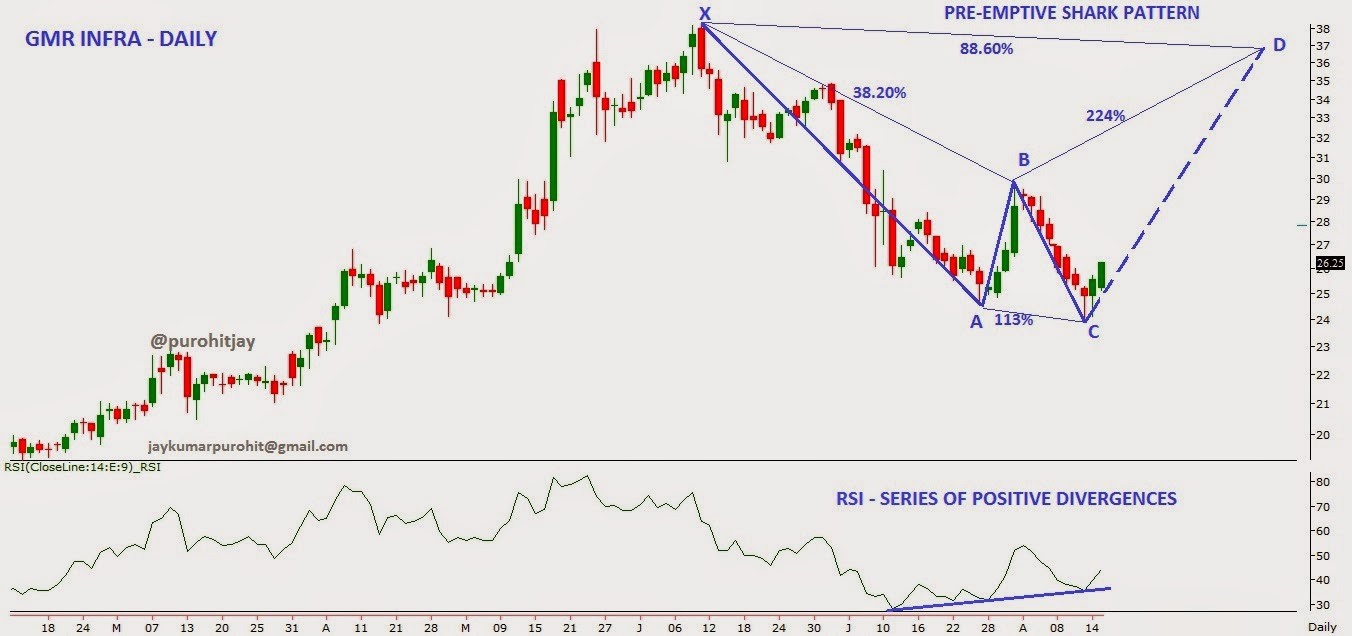
GMR Infra - Pre-emptive Shark Pattern in daily chart
Stock price of GMR
INFRA was moving in sideways direction for two years ending March 2014. The consolidation
phase has resulted into formation of ‘Inverse Head and Shoulder’ in weekly
chart. Stock has given breakout from the same in the month of April 2014.
Before achieving the full target of the mentioned pattern; stock has corrected and
reached back to the breakout levels, which is the natural tendency of the
pattern. Last week counter has retested breakout neckline, which also coincides
with 89-week EMA and started bouncing back after formation of ‘Hammer’ in daily
chart.
On
Momentum Indicator front, RSI is
moving well above the trendline in weekly chart, whereas we are observing
series of positive divergence by RSI in daily chart; indicating reversal on
cards.
If we meticulously observe the
prices in daily chart, we are witnessing emergence of a beautiful harmonic
pattern in daily chart, named as ‘Shark Pattern’.
As
all other indicators and oscillators are moving resiliently in favour of buy
side on the counter along with the harmonic pattern, I'm advising traders to go long in the stock at current market price and on dips to 23.75
for the upside targets of 33/36/42. Stop loss for the trade should be placed
below 22.85 on closing basis.
Sunday, 17 August 2014
Tuesday, 20 May 2014
Is Modi Wave over ??
“Hum Modiji ko lane wale hai.. Acche
Din aane wale hai..” - the most
popular words in India from last three months. Everything has been saffronied by
the Modi Wave.
As
anticipated by market, Modi led BJP came into power with full majority. We have
witnessed a sharp rally actoss the market. After the election results, we are
hearing the targets of 8000, 8400 in Nifty from large foreign as well as
domestic institutions. But there are couple of saying which is so common in the
stock market.
1.
“Buy on rumors, Sell on news”
2. “Sell
May and go away”
Both the
above sayings are contradicting to the bullish view of the institutions, which
creates lot of confusion among retail traders. I respect the views and analysis
of institutions, but the question is “Will market continues the upmove with
same pace or we are heading towards a correction ??” These institutions never
tells us about this, and when Nifty comes to 8000 (even after a healthy
correction upto 6000) they will speak on air about their mentioned targets.
As per my
analysis, the strident rally in Nifty and BankNifty can halt here for a while
before the next rally. Here at current juncture, I’m expecting a correction of
around 5-7% in Nifty and Bank Nifty. It will be a tough hurdle for Nifty to
close above 7550 levels. A close above 7575 will negate the bearish move in the
index and a rally towards 8000 cannot be ruled out. In contrary,
in this correction, Midcap and Smallcap counters can rally and
outperform the broader market.
Now you
must be thinking that - on what basis I’m saying all this ??
So, here is
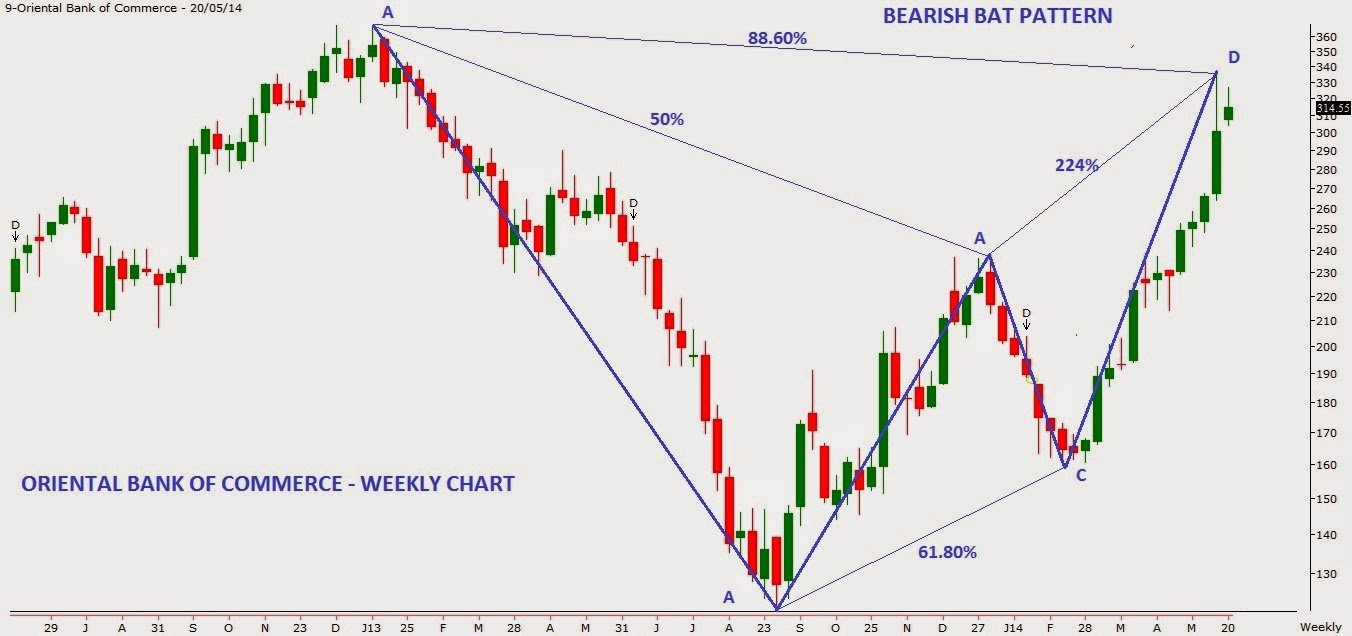
the answer – I’m observing Bearish Harmonic Pattern in many Stocks along with
Indices.
Before
looking at charts, lets discuss what is harmonic pattern ? and how it works ?
Harmonic
Patterns are one of the most reliable patterns, if plotted correctly. They are
completely centered on Fibonacci numbers. The real beauty of this pattern is
that when properly identified, it enables you to enter with the trend in a high
probability reversal zone with minimal risk. There are few Fibonacci ratios
which are commonly used while identifying harmonic pattern. These are 38.20,
61.80, 78.60, 88.60, 50, 113, 127, 141, 161.80, 200, 224, 261.80, 314 and
361.80. There are many types of harmonic patterns viz BAT, BUTTERFLY, GARTLEY,
CRAB AND SHARK.
Below are
the self-explanatory chart of Nifty, BankNifty and best shorting
candidates :
CNX NIFTY - WEEKLY CHART :
BANK NIFTY - WEEKLY CHART :
KOTAK BANK - WEEKLY CHART :
ORIENTAL BANK OF COMMERCE - WEEKLY CHART :
ACC LTD - WEEKLY CHART :
Subscribe to:
Comments (Atom)


